#data #economics
How Efficient Are Economies at Using Their Land – GDP Per Unit Land Area
Published Jul 30, 2018 by Ritij Jain
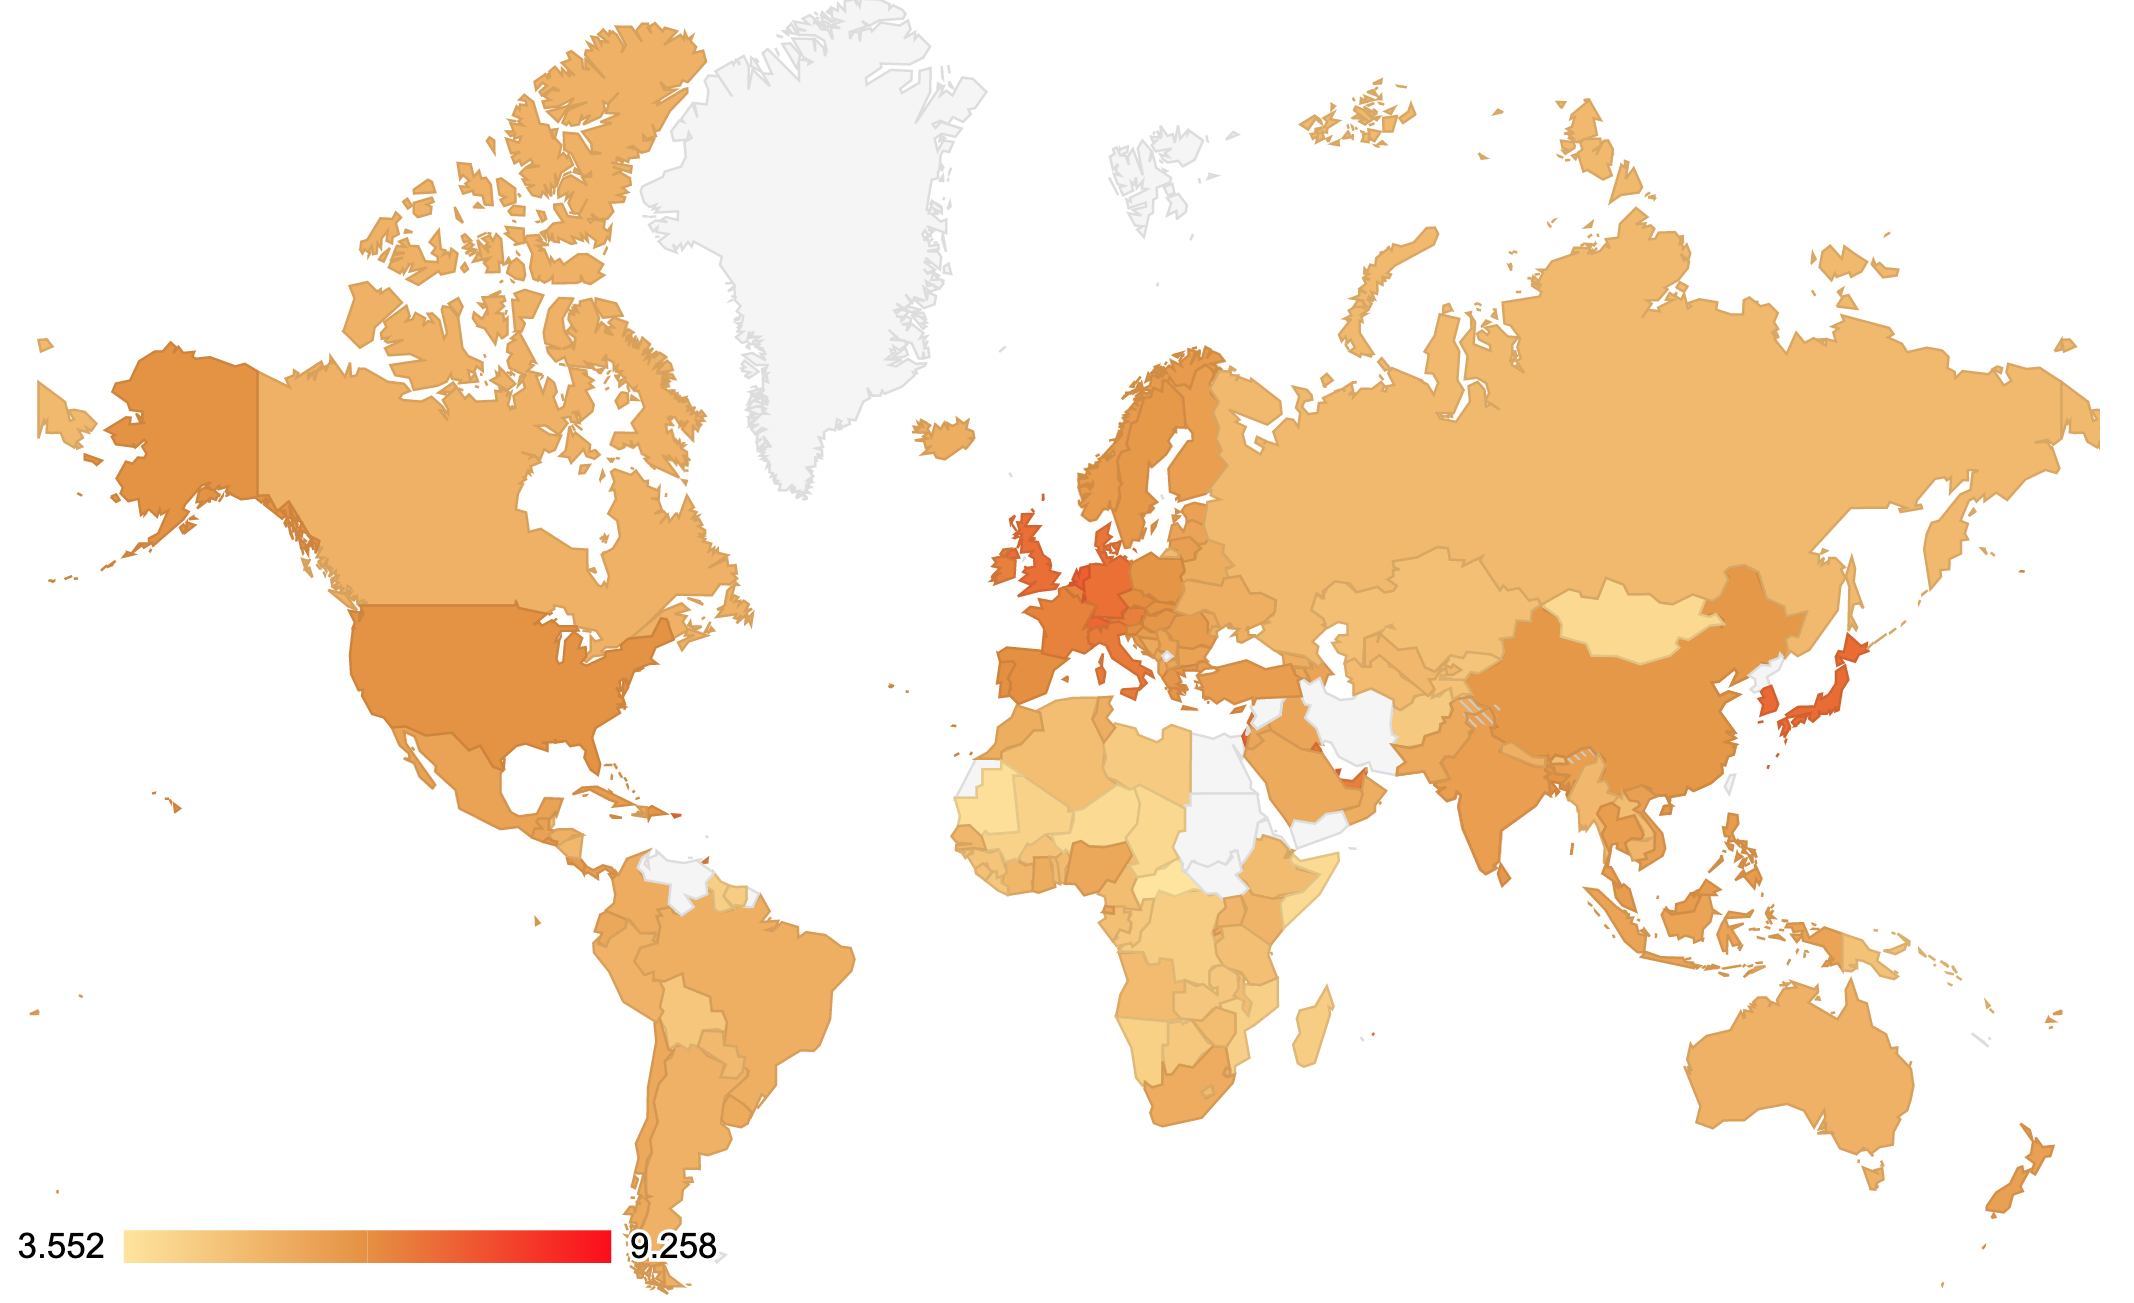
GDP Per Unit Land Area Map (Logarithmic Scale). Light Yellow: Low, Orange: Medium, Dark Red: High
Amongst more than a dozen metrics that can be used to measure economic prosperity, GDP Per Unit Land Area doesn’t seem to get much attention. Nonetheless, it is an interesting metric to look at and gives a new definition of “rich” countries.
GDP Per Unit Land Area Map
The data is highly varied which makes it impossible to use a linear scale for the map. To make it easier to compare different countries, the map below uses a logarithmic scale meaning an increase of one on this scale is equal to a ten-fold increase in the actual values of GDP per Unit Land Area.
 Light Yellow: Low, Orange: Medium, Dark Red: High
It is clear which countries are doing a good job of using their land to benefit their economies. Most of Europe and the two Asian powerhouses, South Korea and Japan come up at the top. Although not visible on the map, the top three: Macao, Singapore, and Hong Kong top the list by far. It is no coincidence that these three are “city-states” which explains their insanely large GDP’s in proportion to their miniature sizes.
Unsurprisingly, the three economic giants: USA, China, and India do relatively well each scoring more than the world average. However, they are still far from the top of the list which is mostly filled with much smaller, more densely populated countries.
GDP Per Unit Land Area Table
The table below lists out the calculated value for GDP Per Unit Land Area for all of the countries and regions for which 2018 data was available from The World Bank Group. This spreadsheet was used to compile this data.
| Country | GDP Per Unit Land Area (million USD per sq. km.) |
|---|---|
| World | 0.675 |
| Macao SAR, China | 1,811.975 |
| Singapore | 513.620 |
| Hong Kong SAR, China | 345.411 |
| Bahrain | 48.517 |
| Malta | 45.479 |
| Luxembourg | 29.171 |
| Netherlands | 27.120 |
| Belgium | 17.925 |
| Switzerland | 17.844 |
| Maldives | 17.758 |
| Israel | 17.125 |
| South Korea | 16.611 |
| Qatar | 16.483 |
| Japan | 13.637 |
| Barbados | 11.965 |
| United Kingdom | 11.802 |
| Puerto Rico | 11.401 |
| Germany | 11.300 |
| Guam | 10.963 |
| Denmark | 8.470 |
| Kuwait | 7.893 |
| Italy | 7.085 |
| Mauritius | 7.005 |
| Andorra | 6.886 |
| Nauru | 6.281 |
| United Arab Emirates | 5.832 |
| Ireland | 5.552 |
| Lebanon | 5.537 |
| Austria | 5.517 |
| Euro area | 5.094 |
| France | 5.073 |
| Trinidad and Tobago | 4.641 |
| European Union | 4.428 |
| St. Kitts and Nevis | 3.888 |
| Antigua and Barbuda | 3.660 |
| Grenada | 3.488 |
| Seychelles | 3.457 |
| American Samoa | 3.180 |
| Czech Republic | 3.176 |
| St. Lucia | 3.151 |
| Northern Mariana Islands | 2.876 |
| Spain | 2.841 |
| Cyprus | 2.702 |
| Slovenia | 2.681 |
| Portugal | 2.627 |
| Brunei Darussalam | 2.574 |
| West Bank and Gaza | 2.428 |
| United States | 2.246 |
| Slovak Republic | 2.203 |
| Bangladesh | 2.105 |
| St. Vincent and the Grenadines | 2.080 |
| Poland | 1.913 |
| Dominican Republic | 1.771 |
| Hungary | 1.744 |
| Greece | 1.691 |
| Post-demographic dividend | 1.591 |
| High income | 1.542 |
| OECD members | 1.528 |
| Central Europe and the Baltics | 1.478 |
| Jamaica | 1.451 |
| China | 1.449 |
| Tuvalu | 1.420 |
| Sri Lanka | 1.418 |
| Sweden | 1.365 |
| El Salvador | 1.258 |
| Bahamas, The | 1.241 |
| Marshall Islands | 1.229 |
| North America | 1.221 |
| Norway | 1.189 |
| Costa Rica | 1.178 |
| Philippines | 1.110 |
| Malaysia | 1.091 |
| Croatia | 1.090 |
| Turks and Caicos Islands | 1.076 |
| East Asia & Pacific | 1.063 |
| Romania | 1.041 |
| East Asia & Pacific (IDA & IBRD countries) | 1.029 |
| East Asia & Pacific (excluding high income) | 1.023 |
| Turkey | 1.002 |
| Thailand | 0.988 |
| Cuba | 0.962 |
| India | 0.914 |
| Finland | 0.911 |
| Panama | 0.875 |
| Lithuania | 0.853 |
| Europe & Central Asia | 0.841 |
| Vietnam | 0.791 |
| New Zealand | 0.778 |
| Dominica | 0.735 |
| Guatemala | 0.732 |
| South Asia | 0.724 |
| South Asia (IDA & IBRD) | 0.724 |
| Estonia | 0.707 |
| Comoros | 0.633 |
| Mexico | 0.628 |
| Tonga | 0.625 |
| Palau | 0.617 |
| Bulgaria | 0.600 |
| Serbia | 0.579 |
| Indonesia | 0.575 |
| Micronesia, Fed. Sts. | 0.574 |
| Azerbaijan | 0.568 |
| Latvia | 0.553 |
| Albania | 0.551 |
| Iraq | 0.517 |
| North Macedonia | 0.502 |
| Late-demographic dividend | 0.498 |
| Cabo Verde | 0.491 |
| Equatorial Guinea | 0.479 |
| Jordan | 0.476 |
| Sao Tome and Principe | 0.440 |
| IBRD only | 0.439 |
| Armenia | 0.437 |
| Ecuador | 0.436 |
| Nigeria | 0.436 |
| Upper middle income | 0.419 |
| Montenegro | 0.409 |
| Pakistan | 0.408 |
| Chile | 0.401 |
| Middle income | 0.397 |
| Bosnia and Herzegovina | 0.394 |
| Rwanda | 0.385 |
| Saudi Arabia | 0.366 |
| Early-demographic dividend | 0.352 |
| Haiti | 0.350 |
| IDA & IBRD total | 0.350 |
| Moldova | 0.348 |
| Low & middle income | 0.344 |
| Uruguay | 0.341 |
| Lower middle income | 0.333 |
| Middle East & North Africa | 0.322 |
| South Africa | 0.304 |
| Fiji | 0.303 |
| Colombia | 0.298 |
| Belarus | 0.294 |
| Samoa | 0.290 |
| Latin America & Caribbean | 0.289 |
| Ghana | 0.288 |
| Latin America & the Caribbean (IDA & IBRD countries) | 0.279 |
| Eswatini | 0.274 |
| Latin America & Caribbean (excluding high income) | 0.274 |
| Morocco | 0.264 |
| Iceland | 0.258 |
| Tunisia | 0.257 |
| Oman | 0.256 |
| Georgia | 0.253 |
| Egypt, Arab Rep. | 0.252 |
| Arab World | 0.247 |
| Kiribati | 0.232 |
| Ukraine | 0.226 |
| Brazil | 0.224 |
| Other small states | 0.223 |
| Small states | 0.214 |
| Honduras | 0.214 |
| Nepal | 0.203 |
| Argentina | 0.190 |
| Canada | 0.188 |
| Australia | 0.186 |
| Caribbean small states | 0.182 |
| Europe & Central Asia (IDA & IBRD countries) | 0.177 |
| Timor-Leste | 0.174 |
| Peru | 0.173 |
| IDA blend | 0.167 |
| Pacific island small states | 0.162 |
| Gambia, The | 0.161 |
| Kenya | 0.154 |
| Europe & Central Asia (excluding high income) | 0.151 |
| Cambodia | 0.139 |
| Uganda | 0.137 |
| Cote d’Ivoire | 0.135 |
| Djibouti | 0.128 |
| Senegal | 0.125 |
| Uzbekistan | 0.119 |
| Burundi | 0.118 |
| Myanmar | 0.109 |
| Nicaragua | 0.109 |
| Paraguay | 0.102 |
| Russia | 0.101 |
| Togo | 0.099 |
| IDA total | 0.093 |
| Benin | 0.092 |
| Lesotho | 0.090 |
| Turkmenistan | 0.087 |
| Angola | 0.085 |
| Ethiopia | 0.084 |
| Belize | 0.082 |
| Cameroon | 0.082 |
| Sub-Saharan Africa | 0.080 |
| Sub-Saharan Africa (IDA & IBRD countries) | 0.080 |
| Sub-Saharan Africa (excluding high income) | 0.080 |
| Zimbabwe | 0.080 |
| Lao PDR | 0.078 |
| Vanuatu | 0.075 |
| Malawi | 0.075 |
| Pre-demographic dividend | 0.074 |
| Algeria | 0.073 |
| IDA only | 0.069 |
| Bhutan | 0.066 |
| Kazakhstan | 0.066 |
| Tanzania | 0.065 |
| Gabon | 0.065 |
| Fragile and conflict affected situations | 0.065 |
| Least developed countries: UN classification | 0.060 |
| Sierra Leone | 0.057 |
| Tajikistan | 0.054 |
| Papua New Guinea | 0.052 |
| Guinea-Bissau | 0.052 |
| Burkina Faso | 0.052 |
| Yemen, Rep. | 0.051 |
| Solomon Islands | 0.050 |
| Guinea | 0.044 |
| Low income | 0.043 |
| Kyrgyz Republic | 0.042 |
| Heavily indebted poor countries (HIPC) | 0.042 |
| Bolivia | 0.037 |
| Zambia | 0.036 |
| Liberia | 0.034 |
| Congo, Rep. | 0.033 |
| Botswana | 0.033 |
| Afghanistan | 0.030 |
| Libya | 0.027 |
| Madagascar | 0.024 |
| Suriname | 0.023 |
| Congo, Dem. Rep. | 0.021 |
| Guyana | 0.020 |
| Mozambique | 0.019 |
| Namibia | 0.018 |
| Mali | 0.014 |
| Chad | 0.009 |
| Mongolia | 0.008 |
| Somalia | 0.008 |
| Niger | 0.007 |
| Mauritania | 0.005 |
| Central African Republic | 0.004 |
Compiled using 2018 data from The World Bank Group .
Spreadsheet used to compile this data.
© 2021, Ritij Jain | <email protected> • GitHub • LinkedIn • Instagram • Twitter • RSS Feed
Pudhina Fresh theme for Jekyll. v20260206235250